
MODEL
A Social Force
foundation.
Velocity-dependent interactions, personal space and contact forces guide each step. Front-weighted repulsion reflects how pedestrians respond to what lies ahead.
Elliptical interaction · Contact forcesUNDERSTAND WHAT’S BEHIND THE MOVEMENT
Explore the models, methods and tools behind traffic, pedestrian and transit studies. Pravaha is being developed as a competitor to PTV Vissim / Viswalk and other simulation platforms; evaluate the supported scope and evidence for each workflow.
Find the capabilities you needGeometry, demand and destinations.
Individual behaviour. Shared spaces.
Recorded playback, analysis and reports.
01 / PEDESTRIAN ENGINE
Each pedestrian has a speed, a destination and a response to the people and spaces around them.
Velocity-dependent interactions, personal space and contact forces guide each step. Front-weighted repulsion reflects how pedestrians respond to what lies ahead.
Elliptical interaction · Contact forcesTen pedestrian classes, sampled walking speeds and social groups represent a varied crowd, including slower walkers and people with reduced mobility.
Speed distributions · Group cohesionRoute people through stairs, escalators, lifts and service points. Congestion-aware portal costs influence the connections they choose.
Multi-level routes · Queue behaviourElliptical, velocity-dependent repulsion (Johansson 2007) plus granular body and sliding-friction contact forces. Validated against Weidmann and bottleneck-egress literature.
Adult, elderly, child, PRM, wheelchair, dismounted cyclist, commuter, shopper, staff and security — each with India-calibrated speed distributions, radius and mass. Set a mix per source.
Couples and families spawn together, walk at the slowest member's pace and stay close under a bounded cohesion force. Solo-only behaviour is bit-identical when unset.
Helbing–Molnár–Farkas–Vicsek front-weighting (λ). λ ≈ 0.2 removes the low-density push-through artifact and is the audited default for quoted figures.
panic_params() reproduces Helbing–Farkas–Vicsek 2000 for emergency egress studies. Never a silent default — you opt in.
Balanced opposing streams self-organise into lanes (order parameter ≈ 0.9) — the qualitative signature of real bidirectional flow.
Emergent from speed heterogeneity rather than scripted; a mixed crowd repairs the shape of the speed–density curve.
Simulator(substeps=N) integrates the stiff contact springs finely for LOS E/F studies without changing external timing.
SciPy cKDTree for cutoff neighbours and sparse Dijkstra for route graphs and floor fields keep the hot path out of Python loops.
Every run reproduces exactly from --seed; a figure that does not reproduce is drift, not noise.
Concourses, platforms, footbridges and underpasses as separate levels. A cross-level Dijkstra route graph plus per-(level, destination) floor fields route each agent to the cheapest stair, escalator or lift.
Capacitated portals with speed factors; an escalator belt boost makes escalators faster than equivalent stairs. Agent ids are preserved across transfers.
Portal traversal time rises with occupancy (BPR-like), so crowds spread across parallel stairs the way people actually do.
Sidewalks, corridors, crosswalks, ramps, waiting areas, ticket gates, platforms and building interiors — all drawn as walkable and obstacle polygons.
Hold pedestrians at a platform edge until a train, or thread them through intermediate points on the way to a weighted destination.
Sources carry demand profiles (steady, pulsed, time-dependent) and weighted destinations, on any level.
Trains and buses arrive on a schedule, open doors for a dwell, then leave. Metro, rail, bus terminal and BRT platforms all model the same way.
A batch of passengers spawns at the door positions and routes to the exits, reusing the demand-pulse machinery.
Waiting passengers board up to the vehicle's capacity; anyone who does not fit waits for the next arrival and is counted.
Crowding, boarding and alighting times and left-behind counts come out in the analysis and the reports.
Ticket counters, gates and security checks as N servers with a service-time distribution — normal (μ, σ) or deterministic.
Shortest-queue gate selection and onward routing after service; queues form and wait times grow with demand exactly as they should.
Queue length over time, mean and 95th-percentile wait, and throughput per service point.
Screening lines with servers, disciplines and onward routing, for airports, stadiums and secure lobbies.
02 / MIXED TRAFFIC
Explore the full Uppal Junction context: four-arm traffic, signalised pedestrian crossings, a raised foot-over bridge and the metro concourse and platform above it.
The composite playback keeps the junction, station access and vertical connections in one reviewable scene.
Car, taxi, SUV, van, pickup, motorcycle, scooter, bicycle, auto-rickshaw, bus, mini bus, articulated bus, school bus, truck, trailer, container, tanker, emergency, tram, LRT and BRT — each with its own dimensions, speed and acceleration. Sample them with Roadway.vehicle_mix.
Intelligent Driver Model per lane: smooth braking, queue discharge in order, red stop lines treated as standing leaders. Chosen over Wiedemann for transparency.
Fixed-time signals with cycle, offset and intervals, shared phase ids across signal groups, one-way kerb stop lines and vehicle hold with clearance.
At unregulated crossings each pedestrian applies an India-calibrated critical gap before stepping out — jaywalking, modelled rather than ignored.
Time-dependent demand profiles per lane, vehicle composition, transit arrivals on a timetable, turning movements measured with lines.
Per-roadway counts, mean speed, delay, queue length, throughput and road LOS A–F, plus first-order CO₂, NOx, PM and fuel by vehicle class — in a "Traffic & emissions" report sheet.
Pedestrian–vehicle conflict counts, crossing delay and vehicle signal delay totals.
Elevated and sunken roads through multi-level projects and the props layer.
03 / ANALYSIS & REPORTS
Metrics are derived from recorded playback, so each result can be traced back to the same simulation.
Review Fruin and IRC:103-2012 bands for walkways, stairs, queues and sidewalks.
Explore density, speed, directional flow, waiting, per-agent delay, clearance time and bottleneck duration.
Compare runs and seeds to see whether a pressure point persists, improves, or moves through the layout.
Area-module bands for each facility type, graded A–F per measurement area and per grid cell.
The authoritative Annexure-I space bands (clause 6.1.5.1), replacing the earlier HCM-2000 placeholder which is kept for reference.
IRC:103-2012 sidewalk space per pedestrian.
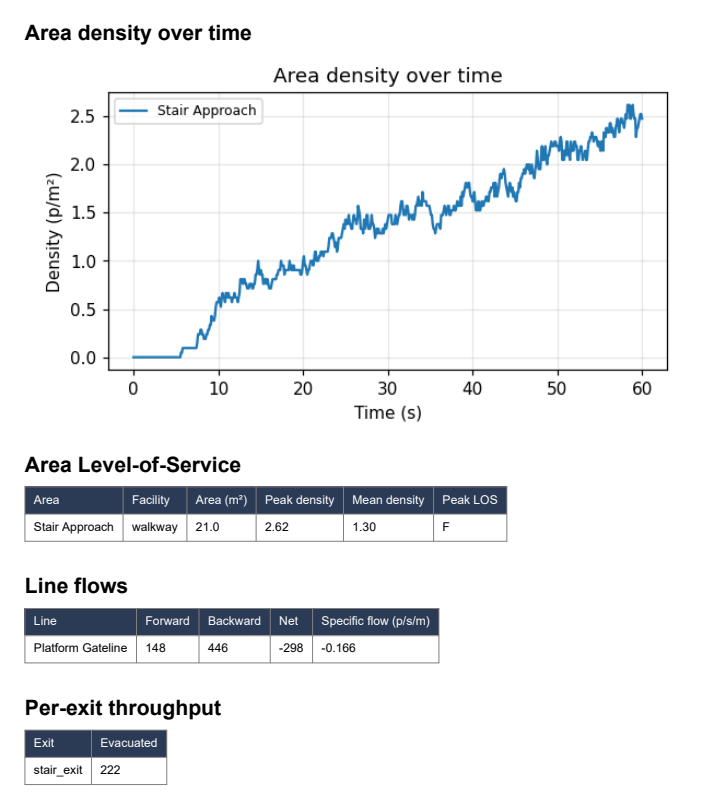
Pedestrians per m² and mean speed inside every measurement area, as time series and as per-cell grid fields.
Directional pedestrian flow across each measurement line, in both directions.
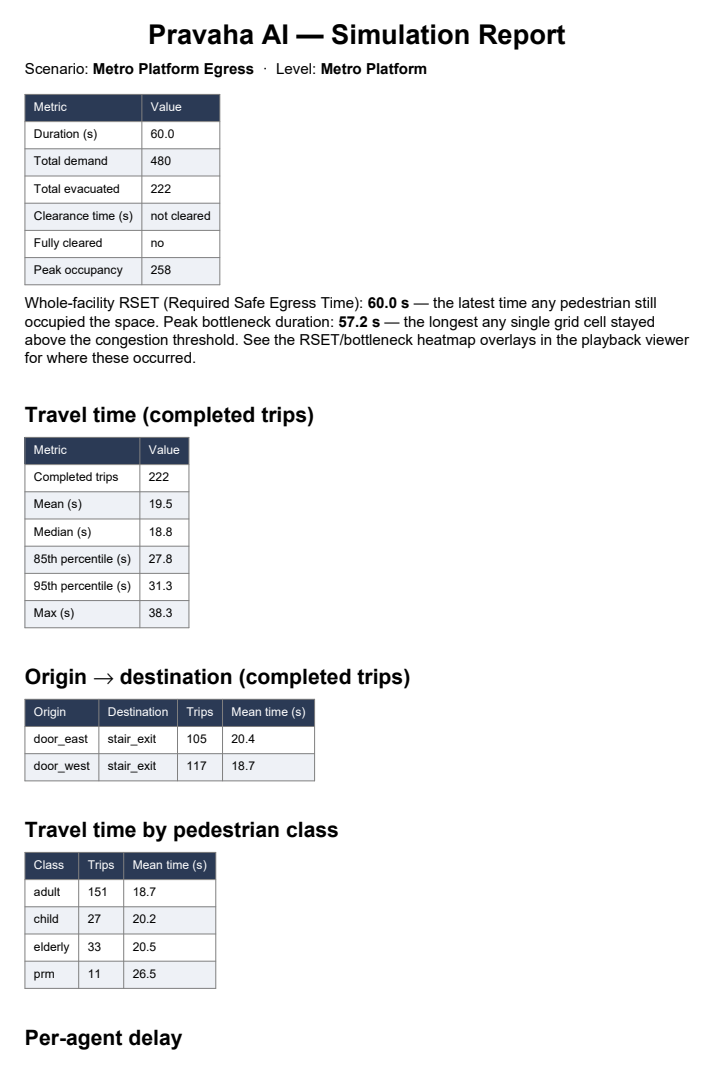
Cumulative egress curve, clearance time, peak occupancy and per-exit throughput; safe sinks for emergency studies.
Per-cell last-cleared time — the required safe egress time drawn on the plan.
Seconds each cell spends above LOS-E density, so a bottleneck is located and timed, not guessed.
Actual minus free-flow travel time for every pedestrian, with mean, median, 85th and 95th percentiles.
Travel time, waiting time, occupancy, queue length and throughput, per area, line, service point and exit.
Density, LOS grade, speed, RSET and bottleneck layers drawn live on the playback and baked into MP4 exports.
One stochastic run is noisy. Re-run across N seeds and Pravaha writes the mean density or speed field next to the across-run spread — the panel that separates a real bottleneck from seed luck.
The summary reports the fraction of cells whose spread exceeds half their mean and warns when N is too small to quote per-cell figures. If every run is identical it says so, rather than reporting a reassuring 0 %.
Summary, density and egress charts, per-agent delay histogram, LOS tables per area, line flows and exit throughput — reportlab, ready to attach to a client submission.
Summary, Areas, Lines, Evacuation, OD travel time, By class, Waiting & signals, Delay, Ensemble and Traffic & emissions sheets, with the raw series for your own charts.
MP4 of any run with a chosen overlay, at a chosen frame rate, from the app or the CLI.
04 / OUTPUTS
Choose the view that answers the question, then export the result for a design review, technical note, or client submission.
Playback and video overlays show where conditions change across the space.
Generate formatted files from the recorded run and its analysis.
Give a project team the context behind the numbers.
05 / INTERACTIVE 3D
Explore animated human models, detailed vehicles and drivers. Orbit the scene, follow a pedestrian, or take a first-person view.
The Uppal station cutaway connects street, concourse and platform levels, with trains, stairwells, escalators and lifts. Its access arrangement follows public station diagrams; dimensions, traffic demand and operating timings are estimated.
Open the updated station demo (opens in a new tab)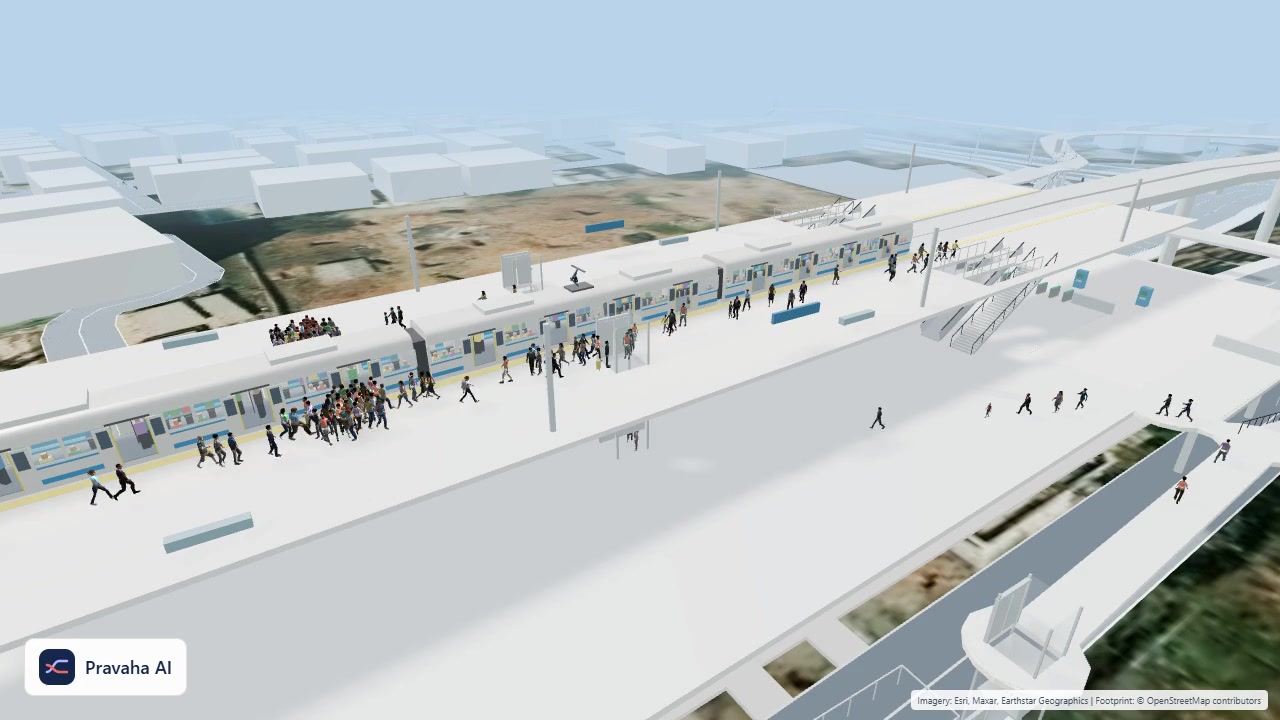
Glass curtain walls, columns, canopy roofs and support pillars extruded from the scenario; staircases and animated escalators built from portals.
Embedded human models with clothing variation, per-class scale and walking animation driven by each pedestrian’s simulated speed.
Recorded vehicles use embedded 3D models with seated drivers and are interpolated between frames alongside the pedestrians.
An eye-height first-person camera, and an automated fly-through for presentations.
Orbit, pan and zoom with Iso, Top, Ground, Follow and Roof presets; play, scrub and speed controls.
The metro station and urban junction show multi-level circulation and mixed traffic. The website junction uses a simplified streetscape with protected movement phases. Props are scenery by contract: the solver never reads them, and a regression test proves furnished and bare runs are bit-identical.
Signal poles with red and green heads that follow the simulated phases.
pravaha-run scenario.pravaha --web3d out.html, Presentation ▸ Export 3D web view in the app, or export_web3d() from Python.
06 / SCENARIO EDITOR
Import the geometry, define the demand and bring the study together in one desktop workspace.
Import DXF or shapefiles, calibrate a background image, or trace over a live satellite or street map.
Set sources, destinations, routes, levels and service points. Adjust their attributes in the editor.
Move between the network editor and playback, inspect the overlays, then develop the next design.
Every object type with a live count and a visibility toggle; click a row to activate its insert tool.
Attribute panel for the selected entity — demand rate, agent type mix, group mix, destinations, capacity, service times, signal timing.
Editable attribute tables for every collection, docked at the bottom.
Add, remove and switch levels; portals connect them.
Each run opens in its own tab with transport controls, a scrub slider, speed selector and overlay picker.
Docks, window size and Quick View fields are remembered between sessions.
Walkable areas, obstacles, sources, sinks, waypoints, portals, measurement areas and lines, signals (2-click stop lines), waiting zones, roadways, crossings, transit lines, service points and scenery props.
Click-anywhere selection including props, drag-move, cut, copy, paste and delete gestures.
Check a corridor width or a door opening in metres before you run.
Pan and Zoom-Window tools, north-up orientation, entity labels and per-layer visibility.
Filled walkable and obstacle polygons, square source and sink glyphs, signal heads, hatched waiting zones, whole-shape selection highlight.
An in-app 3D view with Sync-from-editor.
Load an aerial capture or a floor plan, set the pixel-to-metre scale by clicking a known distance, and trace over it.
Closed CAD polylines from named layers become walkable and obstacle geometry.
GIS polygons straight into a level.
Everything — levels, objects, props, mixes, signals — serialises into one project file with version checks on open.
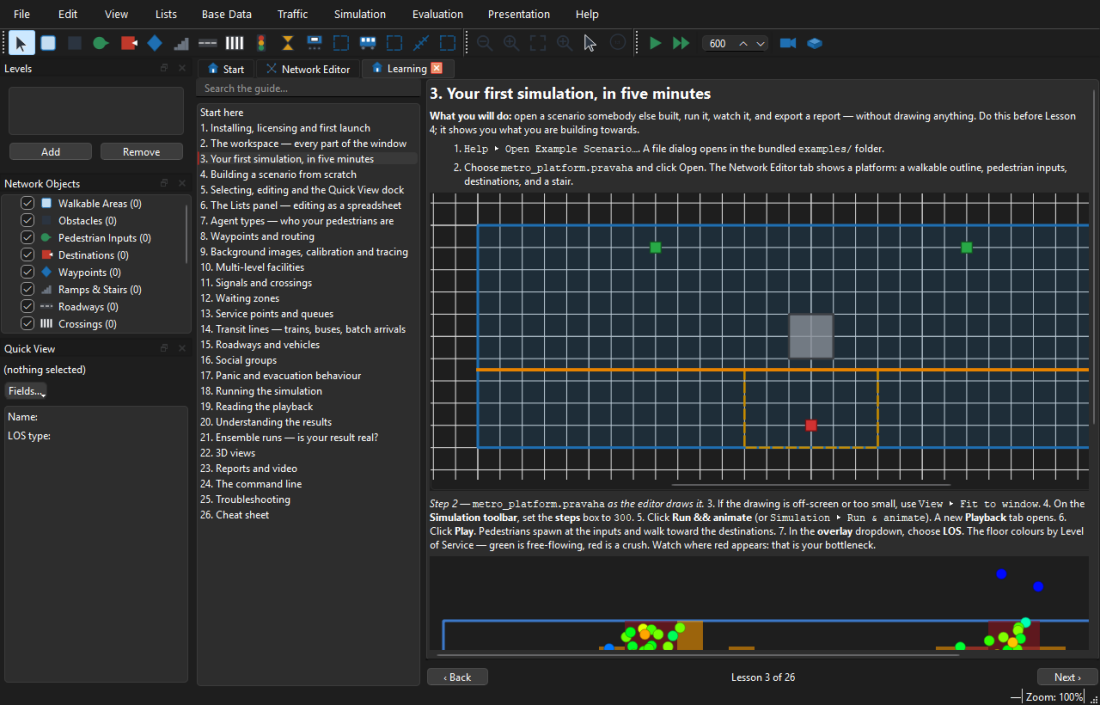
Installing, activating, the 5-minute first simulation, building a scenario, multi-level, reading results, exporting, the CLI and troubleshooting — with 40 screenshots generated from the real application.
A test walks the real menu bar, toolbar and CLI parser and fails the build if any feature exists that the guide never mentions. Shipping a feature means teaching it.
Recent projects and the bundled examples — metro platform, signalised crossing, stadium egress — one click away.
07 / CLI & PYTHON
Run scenarios headlessly, automate batches and reproduce a run from its seed. The engine is importable from Python.
pravaha-run examples/metro_platform.pravaha --video egress.mp4 --overlay los --pdf report.pdf --xlsx report.xlsx --steps 300 --seed 7One recorded run. Video, report and workbook.
# Run the metro platform egress scenario: video + LOS overlay + reports
pravaha-run examples/metro_platform.pravaha \
    --video egress.mp4 --overlay los \
    --pdf report.pdf --xlsx report.xlsx \
    --steps 300 --seed 7

# Average the density field over 20 seeds
pravaha-run stadium_egress.pravaha --ensemble 20 --ensemble-mode density

# Reproduce the engine validation, with a PDF for the reviewer
pravaha-validate --pdf validation.pdf
pravaha-validate --bidirectional          # counterflow: lane formation

# Python
from pravaha.viz.web3d import export_web3d
export_web3d(playbacks, project, "run.html")--video OUT.mp4Export the run as an mp4
--overlay los|density|speed|rset|bottleneckHeatmap layer baked into the video
--pdf OUT.pdfWrite the PDF report
--xlsx OUT.xlsxWrite the Excel report
--web3d OUT.htmlExport the interactive 3D viewer
--steps NSimulation timesteps (default 300)
--seed NRNG seed for exact reproduction
--fps NVideo frame rate (default 30)
--ensemble NRun N seeds and average the field
--ensemble-png OUT.pngWhere to write the ensemble figure
--ensemble-mode density|speedField to average
--ensemble-cell MEnsemble grid cell size in metres
pravaha-validate runs the periodic-corridor experiment against Weidmann and quantifies the deviations (--sigma, --anisotropy-lambda, --bidirectional, --pdf). pravaha-license is the vendor's licence lifecycle — keygen, issue, list, show, renew, revoke, verify. python -m pravaha.fingerprint prints a machine's licence fingerprint.
08 / CAPABILITY MAP
Explore implemented, partial and planned capabilities. Check the stated limits against your project requirements.
No matching capabilities. Try another term or select all statuses.
| Pedestrian microsimulation | Status | How |
|---|---|---|
| Pedestrian types | ||
| Adults, children, elderly | Shipped | India-calibrated default agent types |
| Wheelchair users | Shipped | prm class and wheelchair alias |
| Cyclists (dismounted) | Shipped | cyclist agent type; ridden cycles are the bicycle vehicle |
| Groups | Shipped | Source.group_size_mix with cohesion force |
| Staff, security, shoppers, commuters | Shipped | Added to the default agent types |
| Walking behaviour | ||
| Social Force Model | Shipped | Elliptical Johansson 2007 plus contact terms |
| Individual desired speed | Shipped | Per-agent sampled speeds, per-class distributions |
| Personal space and collision avoidance | Shipped | Social repulsion (A, B, anisotropy λ) |
| Gap acceptance | Shipped | Unregulated crossings |
| Group walking | Shipped | Slowest-member pace plus cohesion |
| Overtaking and following | Shipped | Emergent from heterogeneity |
| Waiting and queue behaviour | Shipped | Waiting zones, service queues |
| Bidirectional and counter flow | Shipped | Validated lane formation |
| Facilities and venues | ||
| Sidewalks, corridors, crosswalks, stairs, escalators, lifts, ramps, waiting areas, ticket gates, platforms, footbridges, underpasses, interiors | Shipped | Walkable geometry, portals, multi-level, signals, crossings |
| Metro and railway stations, bus terminals, airports, ferry terminals, stadiums, malls | Shipped | Transit lines, multi-source demand; stadium egress example ships |
| Crowd management | ||
| Density, flow, capacity | Shipped | Measures, line flow, heatmaps |
| Bottleneck analysis | Shipped | Duration grids and egress-flow model |
| Queue management | Shipped | Service points and queue analytics |
| Evacuation, emergency exits, RSET | Shipped | Evacuation and RSET analysis, safe sinks |
| Fire evacuation and panic | Shipped | panic_params() preset (Helbing 2000) |
| Security screening | Shipped | Service points with disciplines and onward routing |
| Passenger behaviour | ||
| Boarding and alighting, waiting, route selection, platform distribution, transfers, stair/escalator choice, gate selection | Shipped | Transit lines, weighted destinations, portal route graph, congestion-aware costs, shortest-queue discipline |
| Outputs | ||
| Walking speed, density maps, heat maps, travel time, delay, queue length, occupancy, LOS, throughput, waiting time, bottleneck identification | Shipped | PDF and Excel reports, overlays |
| 3D visualisation | ||
| Animated pedestrians and crowd | Shipped | Walk-cycle figures, per-class scale |
| Heat and density maps in 3D | Partial | 2D overlays in video and report; 3D floor overlay is roadmap |
| Camera fly-through | Shipped | Tour button and scripted videos |
| Day / dusk / night lighting | Shipped | Solar clock, streetlights and vehicle headlights |
| Lane-change indicators | Shipped | Amber indicator on the side each vehicle moves to |
| People poses and luggage | Shipped | Standing, seated, phone and hand-holding poses on the same body; bags and suitcases |
| Weather | Shipped | Rain, wet roads, fog and umbrellas per floor |
| Entry and exit portals | Shipped | Lit exit and entry signs on steel door frames |
| Transit signal priority | Shipped | Bus green hold and early green with protected pedestrian minimums |
| Emergency preemption | Shipped | Crossing cleared first, then green, then the plan resumes |
| Zipper merging | Shipped | Work-zone tapers with alternating merges |
| Time-space diagrams | Shipped | Corridor trajectories with the reds each stop line showed |
| Hazard exposure | Shipped | Smoke, heat and CO fields with ISO 13571 dose per person |
| Assisted evacuation and refuges | Shipped | Helpers escort people who need assistance; refuges hold and release |
| Lift banks | Shipped | Multi-car, multi-floor lifts with four dispatch policies |
| Transit operations | Shipped | Vehicle blocks, platform assignment, holding, skip-stop and transfers |
| First-person view | Shipped | Eye-height follow camera |
| Vehicular microsimulation | Status | How |
|---|---|---|
| Road network | ||
| Urban roads and service roads | Shipped | Roadway lane polylines, any alignment |
| Signalised intersections | Shipped | Phases and clearance intervals |
| Unsignalised crossings, gap acceptance | Shipped | Unregulated crossings |
| Roundabouts, interchanges, ramps | Partial | Drawable as lanes; no priority-rule engine at merges |
| Toll plazas | Partial | Model as service points plus roadways |
| Flyovers and underpasses | Shipped | Multi-level plus props |
| Parking facilities | Partial | Scenery and walk-to-car; no parking search |
| Highways and expressways | Roadmap | Free-flow links work; no weaving or ramp metering |
| Vehicles and demand | ||
| Vehicle type catalogue (21 types) | Shipped | Per-type dimensions, speed, acceleration |
| Traffic volumes, time-dependent demand | Shipped | Demand profiles per lane |
| Vehicle composition | Shipped | vehicle_mix |
| Turning movements (measured) | Shipped | Measurement lines |
| OD matrices and per-vehicle route choice | Roadmap | Lanes are fixed paths today |
| Public-transport schedules | Shipped | Transit arrivals |
| Driving behaviour and control | ||
| Car-following | Shipped | IDM per lane (Wiedemann not implemented) |
| Desired speed distributions | Shipped | Per vehicle type |
| Pedestrian × vehicle gap acceptance | Shipped | Crossings |
| Lane changing, overtaking, merging, platooning | Roadmap | Single-file lanes today |
| Fixed-time signals, signal groups, pedestrian crossings, hold and clearance | Shipped | Signal objects with shared phase ids |
| Actuated or adaptive control, transit and emergency priority, ramp metering, VMS, railway crossings | Roadmap | The Signal phase API is the hook point |
| Public transport, incidents, ITS | ||
| Bus routes, stops, bays, dwell, boarding and alighting | Shipped | Scenery plus transit lines |
| Bus priority | Roadmap | Needs actuated control |
| Incidents and closures | Partial | Obstacles and red signals; no mid-run event injection |
| ITS (V2X, dynamic routing, queue warning) | Roadmap | No misleading stubs shipped |
| Environment and data collection | ||
| Emissions and fuel (CO₂, NOx, PM) | Shipped | First-order modal estimates from recorded speed profiles; noise is roadmap |
| Link performance (counts, speed, delay, queue, throughput, road LOS) | Shipped | Per roadway; network rollups partial |
| 3D and integration | ||
| 3D road network, vehicle animation, signal visualisation, camera animation | Shipped | Junction demo |
| Driver viewpoint, day/night and weather, custom vehicle models | Roadmap | FPV follows pedestrians; embedded vehicle models and drivers are available, while the listed camera and customisation features remain roadmap |
| Python scripting | Shipped | The entire engine is importable |
| Excel export / import | Partial | Reports out; import partial |
| CAD (DXF) and GIS (shapefile) import | Shipped | io.dxf_import, io.shapefile_import |
| Database, COM, DLL, OpenDRIVE, signal-controller hooks | Roadmap | Roadmap |
Roadmap capabilities are not implemented. Partial capabilities have limitations listed in the table; check these against the requirements of your study.
09 / VALIDATION & LIMITATIONS
The shipped validation experiment reports behaviour against empirical pedestrian dynamics. Its configuration matters.
Periodic corridor · 2,000 steps per density point · desired-speed dispersion σ = 0.15 m/s · anisotropy λ = 0.2. Run pravaha-validate to reproduce the experiment.
substeps=4–5 shrinks the 2.0 p/m² deficit to −6 %.10 / FROM THE APPLICATION
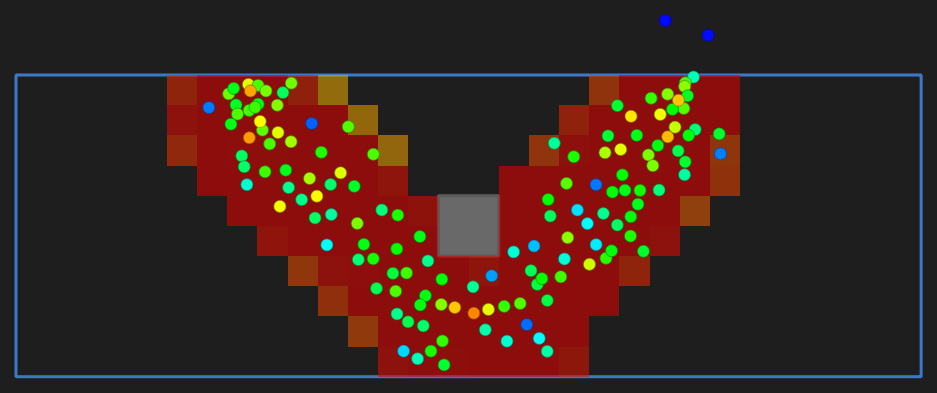
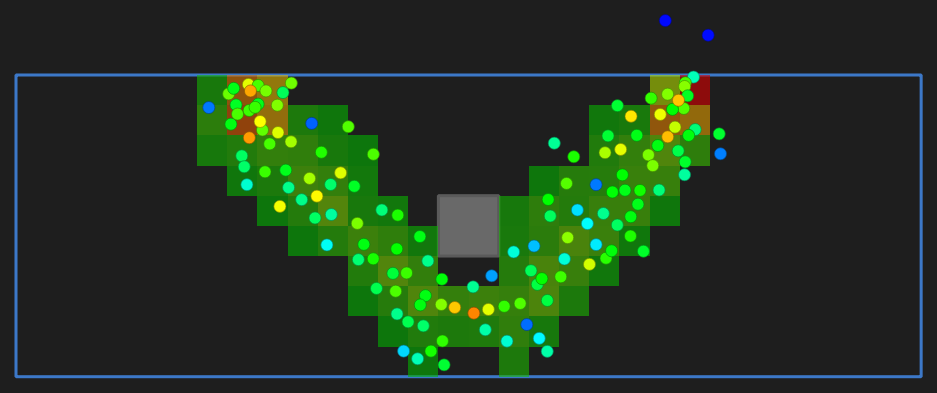
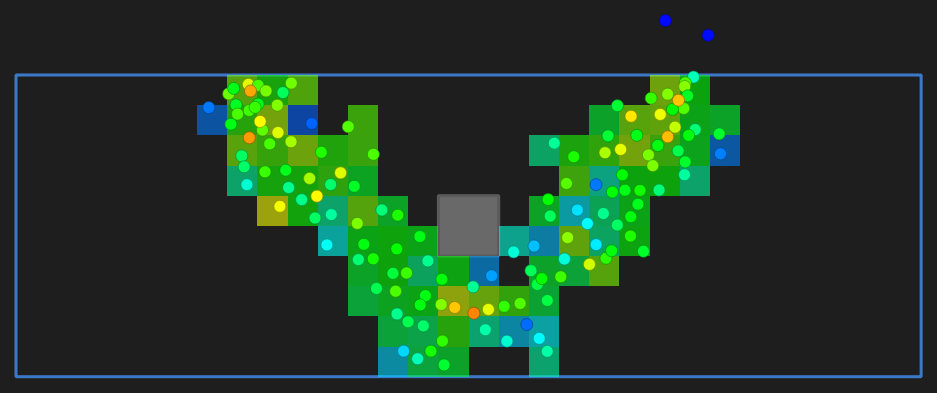
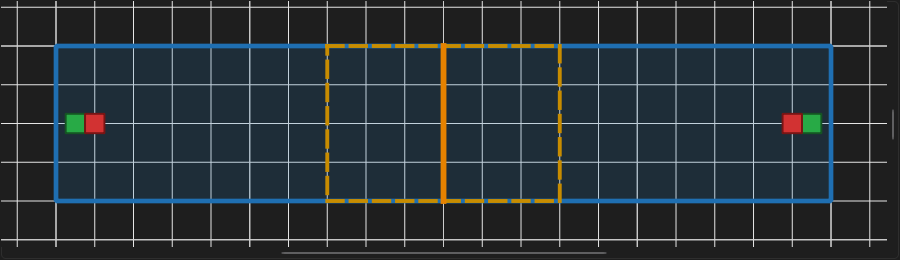
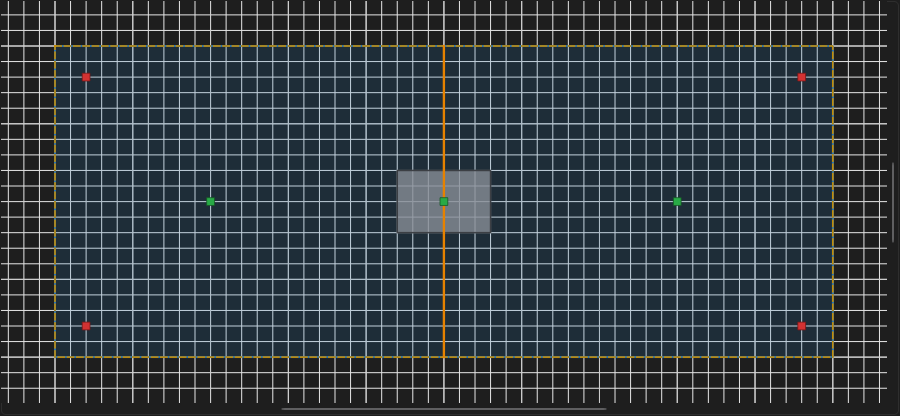
Actual application screenshots, exported scenes and reports.
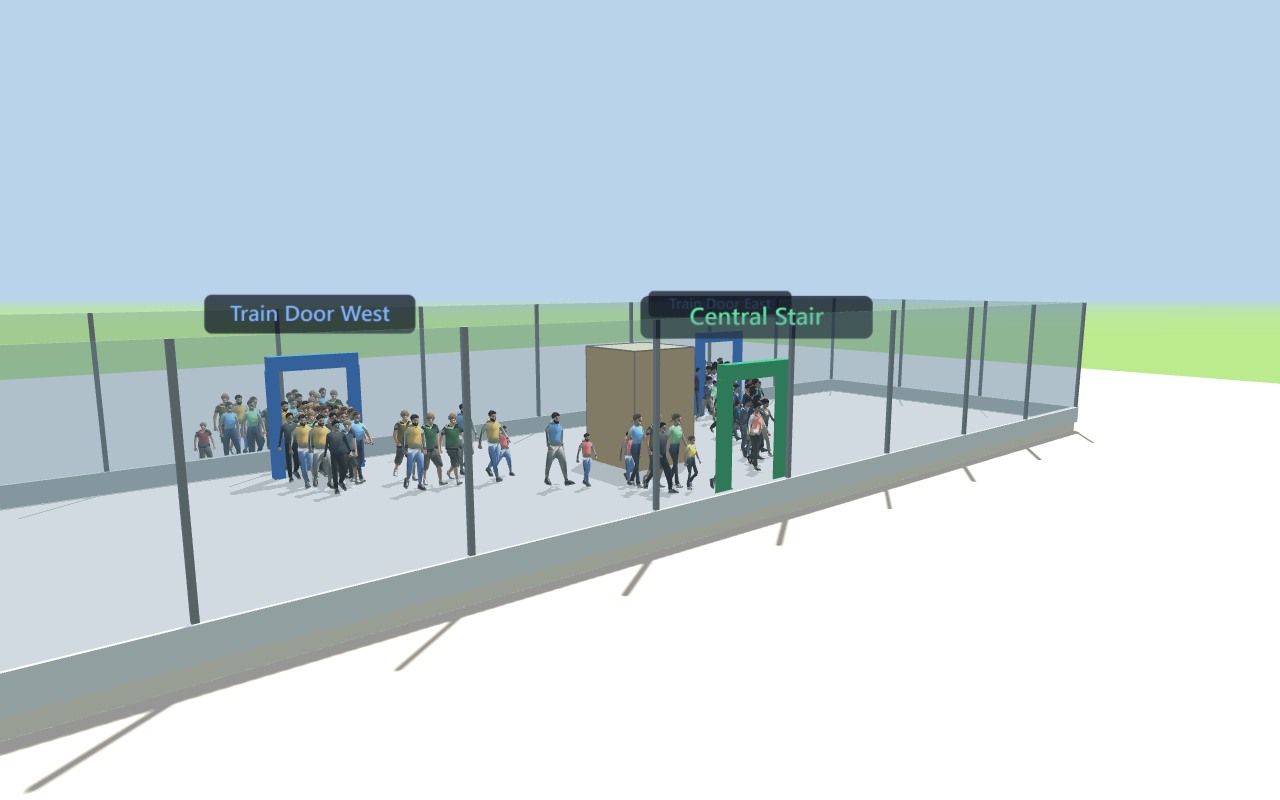
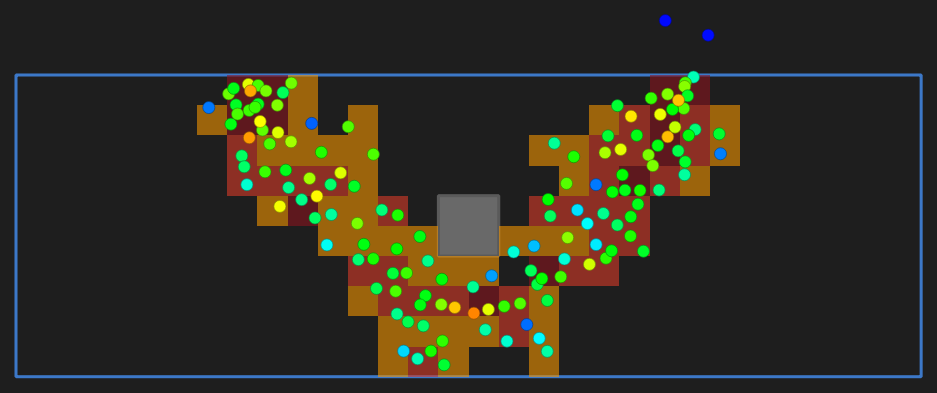
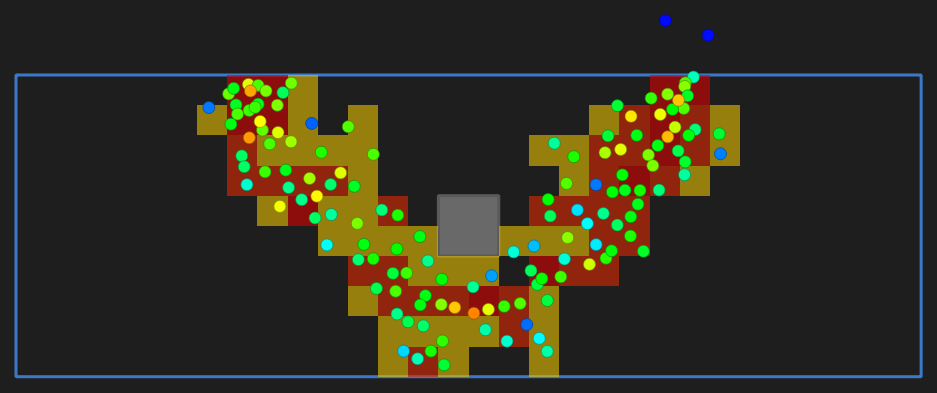

11 / LICENSING & INSTALLATION
Pravaha runs on Windows with offline licensing. Discuss a machine or site licence, a trial, or requirements for an air-gapped environment.
Talk about your projectA packaged desktop application, with no separate Python installation required.
Run the simulation locally and activate with a signed licence key.
python -m pravaha.fingerprint or the Activation dialog.pip install -e ".[ui]", then python -m pravaha.app.The NOTICE file lists every open-source component. Qt/PySide6 is used under the LGPL v3, shipped as separate DLLs so the user can substitute their own Qt build. NumPy, SciPy, Matplotlib, reportlab, openpyxl and imageio-ffmpeg complete the stack.
Metro and rail operators, transport consultants, station and terminal designers, stadium and event planners, fire-safety and egress consultants, and public agencies applying IRC:103 — anyone who needs a defensible pedestrian study without a six-figure suite.
